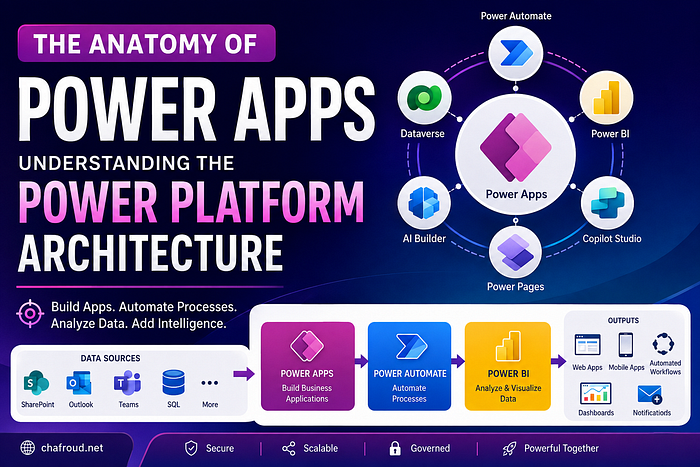
Microsoft Power Platform is often introduced one tool at a time first Power Apps, then Power Automate, then Power BI and that approach makes it easy to miss the bigger picture:
these tools aren’t separate products bolted together, they’re a connected system built around a shared data layer. This guide walks through that system visually, using architecture diagrams that show how the pieces actually fit.
1. The Power Platform at a Glance
Before diving into architecture, it helps to see the full family of tools in one place.
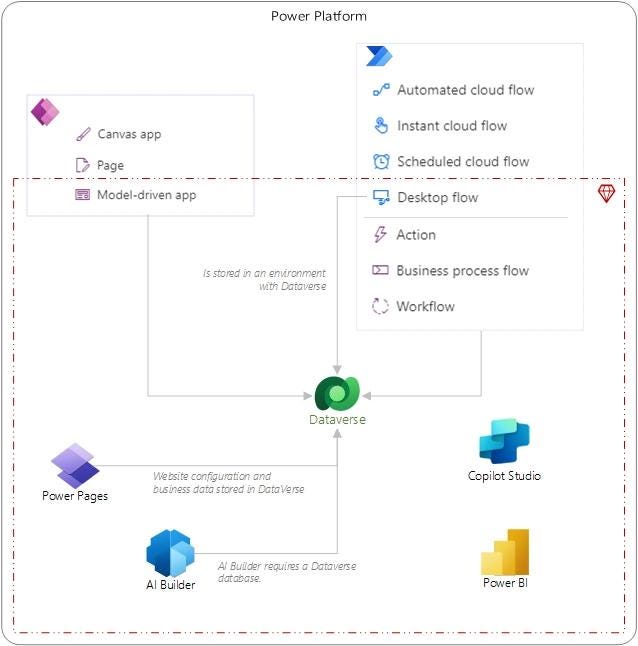
At the center sits Dataverse, the common data platform that almost everything else reads from or writes to. Around it:
• Power Apps give you two app models Canvas apps (and Pages, their newer building block) for pixel perfect, drag-and-drop design, and Model-driven apps for apps generated directly from your data structure.
• Power Automate covers automation in several flavors: automated cloud flows (trigger-based), instant cloud flows (manually triggered), scheduled cloud flows (time-based), and desktop flows for RPA on local machines plus business process flows and workflows for guiding structured processes.
• Power Pages builds external-facing websites whose configuration and business data live in Dataverse.
• AI Builder adds AI models into your apps and flows and notably, it requires a Dataverse database to function.
• Copilot Studio and Power BI round things out for conversational AI and analytics.
The key takeaway from this diagram: everything inside the dashed boundary depends on being stored in an environment with Dataverse. That boundary is the architectural backbone of the whole platform.
2. Why Dataverse Is the Hub, Not Just Another Data Source
Zooming into Dataverse itself makes its role clearer it isn’t just a database option, it’s the integration point that lets every tool talk to every other tool.
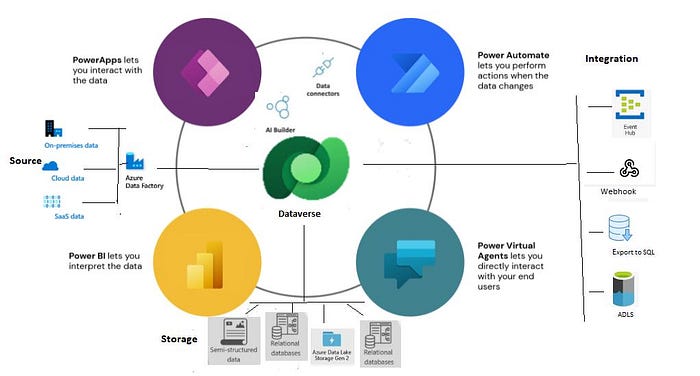
Reading this diagram clockwise:
• Power Apps lets you interact with the data sitting in Dataverse.
• Power Automate lets you act on the data running processes whenever records change.
• Power BI lets you interpret the data turning it into reports and dashboards.
• Power Virtual Agents (now part of Copilot Studio) lets end users interact with that data conversationally.
Feeding into Dataverse on the left, data connectors and Azure Data Factory pull in data from on-premises systems, cloud data, and SaaS applications. Underneath, Dataverse can also draw on semi-structured data, relational databases, and Azure Data Lake Storage Gen2. On the right, an integration layer pushes data out through Event Hub, webhooks, SQL exports, or ADLS meaning Dataverse isn’t a closed box; it’s a two-way bridge between your low-code apps and the rest of your enterprise systems.
3. Scaling Up: The Full Enterprise Architecture
Once a Power Platform solution grows past a single app, it typically starts pulling in genuine enterprise infrastructure security, orchestration, and external data. This is what that looks like in practice.
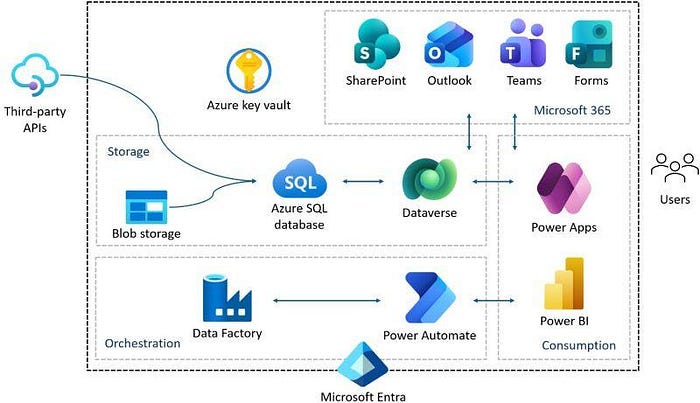
A few things stand out in a production-grade setup like this:
• Storage splits across Blob storage and Azure SQL database, both feeding into Dataverse useful when you have data volumes or types that don’t belong in Dataverse itself.
• Azure Key Vault sits alongside Dataverse to protect secrets, connection strings, and credentials rather than storing them in flows or apps directly.
• Orchestration is handled by Data Factory (for bulk data movement) and Power Automate (for process automation), both governed centrally by Microsoft Entra for identity and access.
• Microsoft 365 SharePoint, Outlook, Teams, and Forms connects directly into this architecture, which is why Power Platform solutions so often start life as “just automate this Teams/SharePoint process.”
• Third-party APIs connect in from the outside, usually via Blob storage or custom connectors, rather than touching Dataverse directly.
• Power Apps and Power BI, at the top, remain the consumption layer what actual users interact with.
This is essentially the same core loop as the simpler diagram above (Apps → Dataverse → Automate → BI), just with the identity, security, and integration plumbing made explicit.
4. The Same Architecture, Reframed
Here’s a cleaner, more presentation-friendly version of the same concept useful when you’re explaining Power Platform to stakeholders who don’t need the full technical detail.
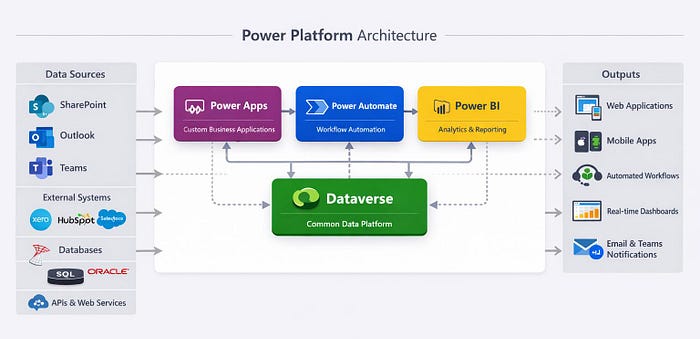
This view groups things by role rather than by product:
• Data Sources on the left SharePoint, Outlook, Teams, external systems like Xero, HubSpot, and Salesforce, plus traditional databases and APIs.
• The processing core in the middle Power Apps for building custom business applications, Power Automate for workflow automation, and Power BI for analytics all wired through Dataverse as the common data platform.
• Outputs on the right the actual deliverables: web apps, mobile apps, automated workflows, real-time dashboards, and notifications.
It’s the same story told three times now, at increasing levels of detail which is deliberate. If you only remember one thing about Power Platform architecture, it should be this: data flows in, Dataverse holds it, the three core tools act on it, and value flows back out.
5. Two App Models: Canvas vs. Model-Driven
Power Apps itself isn’t one thing it’s two different ways of building an app, and the architecture diagram makes the distinction obvious.
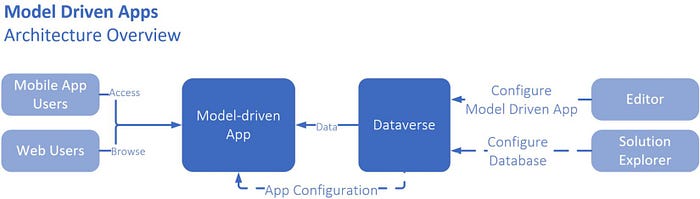
A model-driven app is essentially generated from your Dataverse schema. You configure the database structure in Solution Explorer, configure the app’s views and forms in the Editor, and the app itself is largely assembled automatically mobile and web users just access and browse the result. This is the right choice when your app should closely mirror well-structured, relational business data (case management, inventory, CRM-style apps).
A canvas app, by contrast, is built the opposite way you design the interface first, pixel by pixel, and connect it to data afterward. That’s the model you see in the Power Apps Studio itself:
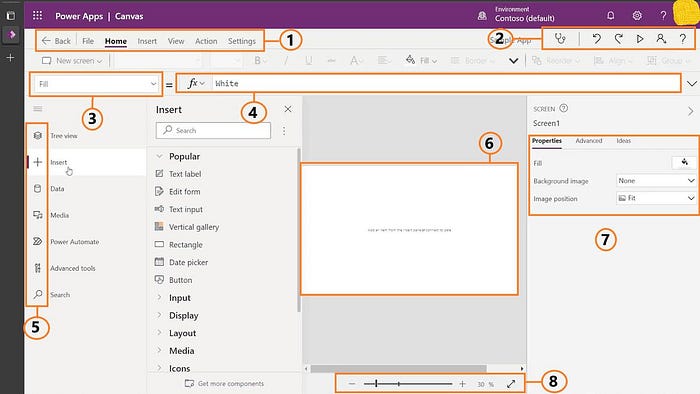
This is the actual working environment, broken into its functional zones:
1. Ribbon Home, Insert, View, Action, and Settings menus for building and configuring the app.
2. Top-right toolbar save, undo/redo, run/preview, and collaboration/help tools.
3. Left navigation rail switches between Tree view, Insert, Data, Media, Power Automate, Advanced tools, and Search.
4. Insert panel the component library: labels, forms, inputs, galleries, and layout elements.
5. Collapsed rail same rail, showing the icon-only collapsed state.
6. Canvas the actual design surface where you place and arrange controls.
7. Properties panel Fill, background image, and other settings for whatever’s selected.
8. Zoom controls for adjusting your view of the canvas.
And here’s that same Insert panel in use, with Edit form selected the control you’d use to bind a screen directly to a Dataverse table or other data source without hand-building every input field:
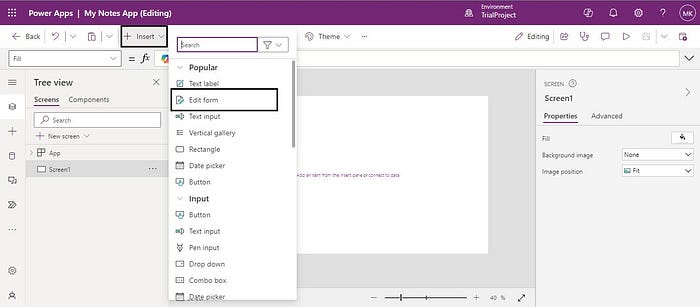
This single screenshot ties the whole guide together: a canvas app, built visually, being connected to structured data which is exactly the relationship the very first diagram described between “Canvas app / Page / Model-driven app” and “Dataverse.”
Putting It All Together
Whether you’re looking at the simplest overview or the full enterprise diagram with Key Vault and Data Factory, the underlying pattern never changes:
1. Data comes from somewhere (Microsoft 365, external systems, databases, APIs).
2. Dataverse stores and governs it centrally.
3. Power Apps, Power Automate, Power BI, and Copilot Studio each provide a different way to interact with that data.
4. Security and identity (Entra, Key Vault) and orchestration (Data Factory) hold the whole thing together as it scales.
Once that mental model clicks, every individual feature an Edit form, a cloud flow trigger, an AI Builder model stops looking like an isolated tool and starts looking like exactly what it is: one more way of touching the same shared data platform.